

Using Data to Transform Classrooms and Systems Across Ghana
1.0 Introduction
In classrooms and communities across Ghana, data is quietly powering a transformation. From national education initiatives to innovative school-level tools, information is being used to shape decisions, tailor support, and unlock better learning outcomes. At Lead For Ghana (LFG), data isn’t just numbers on a dashboard—it’s a catalyst for change. Through strategic data collection and tracking, LFG monitors Associate development, student progress, and school-wide improvement to deliver targeted coaching and interventions that make a real difference. By aligning these efforts with broader education priorities, LFG is helping bridge classroom realities with system-wide change. This month’s edition explores how data is driving transformation across Ghana’s education landscape, highlighting the tools, successes, and challenges that are shaping the future of learning.
2.0 National Education Database Systems
In recent years, the Ghana Education Service (GES) and the Ministry of Education (MoE) have taken significant steps to improve the collection, management, and use of education data. These efforts are aimed at strengthening decision-making, improving accountability, and enhancing the delivery of quality education nationwide. Central to this agenda is the development and expansion of education database systems that enable better monitoring of school performance, teacher deployment, student outcomes, and resource allocation. In this blog, we touch on the Education Management Information System (EMIS), the National Schools Inspectorate Authority (NaSIA) database, and the Mobile School Report Card (mSRC) database.
2.1 Education Management Information System (EMIS)
The Education Management Information System (EMIS) is a central pillar of Ghana’s education data system, designed to collect and manage comprehensive school, teacher, student, and infrastructure data nationwide through the annual school census (Cambridge Education, 2006). Currently, a publicly accessible EMIS dashboard is available on the MoE Data Dashboard website showing information on student gross and net enrollment rates, number of teachers and trained teachers, student repetition from 2021 to 2025. The centralized EMIS database supports planning, policy formulation, and international reporting, while informing resource allocation, particularly in underserved areas. EMIS has also been instrumental in tracking enrollment and infrastructure needs for major policies like the Free Education program (Aheto & Fletcher, 2012). EMIS has contributed to improved decision-making by providing reliable and timely data for planning, monitoring, and evaluation. It has enhanced administrative efficiency, supported evidence-based policymaking, and strengthened strategic planning in institutions (Abdul-Hamid, Saraogi, & Mintz, 2017). Despite these successes, EMIS in Ghana faces notable challenges, including data quality and timeliness issues, inadequate ICT infrastructure, limited technical support, and funding constraints (Abdul-Hamid, Saraogi, & Mintz, 2017). A persistent fragmentation exists between EMIS and private schools, where reluctance to share accurate data reduces system completeness and reliability. Addressing these issues through investment, training, and better system integration is essential to fully harness EMIS’s role in supporting educational policy and development (Abdul-Hamid, Saraogi, & Mintz, 2017).
2.2 National Schools Inspectorate Authority (NaSIA) Database
The National Schools Inspectorate Authority (NaSIA) maintains a database built through school registration, licensing, and inspection activities. It collects data on school licensing status, compliance with infrastructure and teaching standards, governance and management practices, curriculum delivery, and overall school performance. This information serves as a critical quality assurance mechanism within Ghana’s education system (NaSIA, 2022). The NaSIA database has improved accountability and regulatory oversight across both public and private schools. By focusing on standards, school leadership, and curriculum delivery, it complements EMIS, which primarily captures enrollment, staffing, and infrastructure data. This added layer of quality assurance strengthens monitoring of school performance and supports more informed policy decisions. While NaSIA continues to make significant progress in ensuring quality standards across schools, it continues to face a number of operational and contextual challenges. Difficult terrain, poor road networks, and the inaccessibility of some schools, particularly in remote areas, hinder timely and comprehensive inspection coverage (NaSIA, 2021). In addition, inadequate infrastructure, unreliable internet connectivity, and the absence of key school personnel during inspection visits sometimes delay data gathering and validation. Despite these challenges, NaSIA remains committed to improving its operational efficiency and strengthening collaboration with key stakeholders to enhance educational quality and accountability across the country (NaSIA, 2021).
2.3 Mobile School Report Card (mSRC) Database
The Mobile School Report Card (mSRC) is an innovative digital platform developed by the Ghana Education Service (GES), with support from UNICEF, to improve the collection, management, and use of school-level data. Launched in 2014 as a mobile-based alternative to the paper-based School Report Card (pSRC), the mSRC was designed to address delays, data inaccuracies, and inefficiencies in traditional data reporting systems (Abdulai, Nunyonameh, & Salifu, 2018). The mSRC operates through two main interfaces — a mobile app for data entry and a web-based dashboard for analysis and reporting. Head teachers use the app to record weekly and termly data on indicators such as teacher and student attendance, lesson note submission, assessment practices, and school facilities. These inputs are automatically transmitted to district dashboards for verification and aggregation, allowing education officers to monitor trends and make prompt management decisions across Ghana. Initially piloted in three districts, the mSRC has expanded to cover over 1,800 basic schools across 20 districts as at 2018, providing timely, reliable, and actionable information to education officers, head teachers, and policymakers. Its introduction marks a significant step in Ghana’s broader efforts to build a culture of data-informed decision-making within the education sector (Abdulai, Nunyonameh, & Salifu, 2018).
2.4 National databases on student academic outcomes
Two main bodies are responsible for conducting and maintaining a national database on student academic outcomes, namely the West African Examination Council (WAEC) and the National Council for Curriculum and Assessment (NaCCA). WAEC is responsible for conducting the Basic Education Certificate Examination (BECE) and the West African Senior Secondary Certificate Examination (WASSCE), which is administered to all Basic 9 and Basic 12 students respectively (WAEC, n.d.). NaCCA is responsible for conducting the National Standardized Test (NST), administered to a sampled number of students in Basic 2, 4, 6, 8 and 11 (NaCCA, 2020). Insights from these data sources help identify learning gaps across regions, subjects, and socio-economic groups. This information guides resource allocation in schools, targeted interventions and policy formulation, all of which aim to improve teaching and learning experience and to improve student outcomes.
3.0 The LFG Approach
At LFG, education data plays an important role in the service delivery and support to Associates, students and schools. During the two-year program, LFG collects data to track Associates’ trajectories in the desired leadership competencies. This data is collected through observation of Associates in the classroom, coach conversations with Associations and through feedback from school leaders and students. Coaches, who provide support to Associates, use this information to initiate conversations with and provide guidance and support to Associates ensuring that Associates are developing as effective leaders for the country. The main type of data collected on students are their attendance and performance data (Figure 1). Student-level data on learner attendance and performance provides direct information to Associates about the specific student-learning shortfalls and can be used as a starting point to figure out other challenges that impact learning. Associates, with the support of coaches, can use this information to identify possible strategies that can be used to improve the learning and teaching experience for students. Finally, as LFG activities also target school-wide improvements, we also collect school-level data. Two of the key aspects of school improvement that we currently focus on are school culture and community leadership. This year, we conducted the first annual census in LFG partner schools to provide a snapshot of the school culture and status of community engagement in LFG schools. This information will be used to inform the design of school-level interventions to improve school culture and community engagement in LFG partner schools. Our previous blog post discussed some of the findings on the nature of community leadership in LFG partner schools.
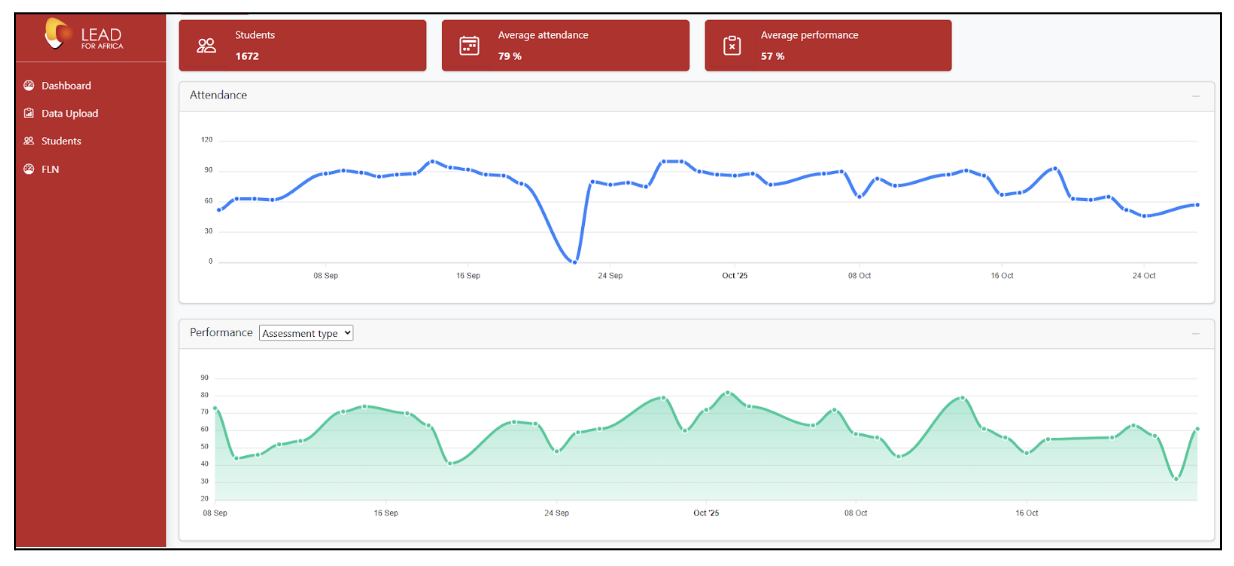
Figure 1: Snapshot of students’ attendance and performance data in some LFG partner schools
LFG’s ambitious efforts to collect educational data to improve the organization’s programming has not been without any challenges. Manual data entry of student attendance and performance data affected the quality and integrity of data being collected. Poor data culture in some schools and district education offices have also hindered quick and easy access to relevant data needed to make more informed decisions. Despite these challenges, the organization is committed to taking steps to facilitate the collection and use of quality data for program activities. For instance, Associates now have a dedicated mobile and web application (Figure 2) to support easier collection of data on students’ attendance and performance. In addition, during periodic professional development sessions with school leaders and teachers, LFG shares with school leaders the type of data that the organization collects, how LFG uses that data, and how school leaders and teachers can also use that data. By being transparent about the data collected, LFG aims to get buy-in from school leaders and teachers in LFG partner schools and also improve data culture in these schools.
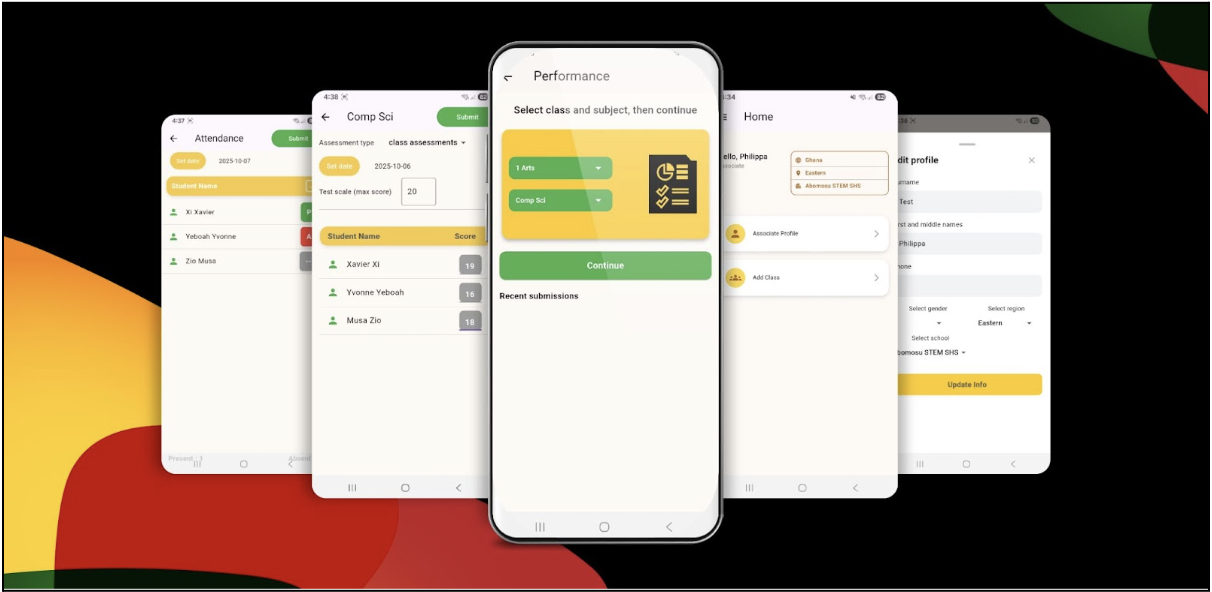
Figure 2: LFG’s Students Attendance and Performance Tracker app

4.0 Conclusion
Behind every dataset is a human story — a child finding their voice, a teacher refining their craft, a leader shaping a new vision. Data becomes transformational only when it leads to action, empathy, and equity.
At LFG, we believe that data is not an end in itself but a means to unlock potential — for individuals, schools, and the entire education system. As we continue to refine our data systems and collaborate with partners across the country, our commitment remains clear: To use data not just to measure progress, but to create it.
5.0 References
Abdulai, A.-G., Nunyonameh, C., & Salifu, A. (2018). Final report: Operational research on the use of the Mobile School Report Card (mSRC) as a management tool. Ghana Education Service (GES) and UNICEF.
Abdul-Hamid, H., Saraogi, N., & Mintz, S. (2017). Lessons learned from world bank education management information system operations: Portfolio review, 1998-2014. World Bank Publications.
Aheto, Simon-Peter & Fletchert, J.. (2012). Looking through the Lenses of Educational Management Information Systems (EMIS). International Journal of Computing Academic Research. 1. 10-24.
Cambridge Education. (2006). Education Management Information System: A short case study of Ghana (Working Paper No. 4). infoDev / The World Bank. Edited by Michael Trucano.
National Council for Curriculum & Assessment (NaCCA). (2020). National Pre-tertiary Learning Assessment Framework (NPLAF).
National Schools Inspectorate Authority (NaSIA). (2022). School performance plus inspection aggregate report on 400 inspected BIGWIN schools. Ministry of Education, Republic of Ghana.
National Schools Inspectorate Authority (NaSIA). (2021). Aggregate report on GALOP school performance plus inspections. Ministry of Education, Republic of Ghana.
West Africa Examination Council (WAEC). (n.d.). West Africa Examination Council (WAEC) - Official Website. WAE. Accessed data: 28/10/2025